Housing is expensive in Ontario
The Missing Middle Initiative, which is a research group housed at the University of Ottawa's Institute for the Environment, just published this detailed report on Southern Ontario's housing affordability crisis.
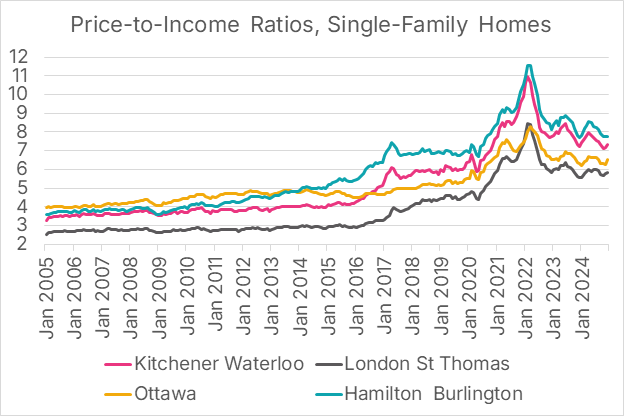
As we know, things are not good: In 2005, 21 of 26 single-family house markets in Southern Ontario could have been classified as either affordable or deeply affordable for middle-class families, and none were unattainable.
Today, none of these markets can be considered affordable or deeply affordable, and 11 of them are now unattainable. In every single one of these markets, buyers should expect to pay 25% or more of their pre-tax income on mortgage payments.
Below is one of their charts showing the price-to-income ratios for single-family houses in various markets since 2005. Outside of the Greater Toronto Area, the turning point toward worsening affordability was generally in 2016, and the peak was in 2022.
Here's some historical context. Canadians who had mortgages in the late 70s and early 80s often like to talk about how crippling rates were back then. But interestingly enough, monthly payments — relative to wages — are actually worse today than they were during this high-rate period (according to the report).
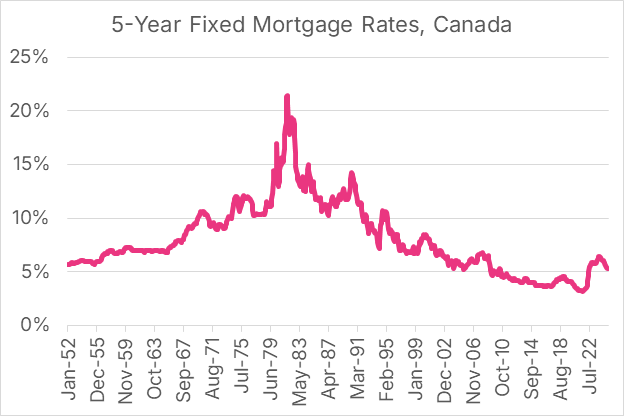
This is partly because home prices were a lot lower back then and so high rates didn't have the same impact to mortgage payments. Instead, the two worst periods of time for affordability (payments relative to wages) were during the late 80s housing boom and then during/after the recent pandemic.
Following the real estate crash of the early 90s, monthly payments relative to wages declined along with home prices. And they didn't return to the same levels seen during the preceding boom until 2022 — some thirty years later.
The same thing is happening right now. This reset is naturally improving affordability. But it really should be viewed as an opportunity to course correct before the next cycle begins. MMI's report does a good job explaining that housing is objectively less affordable today than it was for prior generations.
Charts from the Missing Middle Initiative; cover photo by Victor Ballesteros on Unsplash
What housing type have you lived in the most throughout your life?
I started thinking about this the other night. For the first 18 years of my life, in other words, up until I moved away to university, I lived for the most part in a detached single-family house in the suburbs of Toronto. But since then, I have almost exclusively lived in apartments/condominiums ranging from converted houses to high-rise buildings.
This was true when I was at the University of Toronto and it was true when I lived in Philadelphia for grad school. In my first year of grad school I lived in a converted house in a questionable area of West Philly. In my second year I lived in a high-rise brutalist building. And in my third year I lived in a small three level walk-up apartment above a pet store and a really great deli. This perhaps not surprising given I was a student.
But since moving back to Toronto, the same has been true. I initially invested and lived in a single-family house, but then decided I preferred living in a condominium and so I have done that ever since. Maybe this changes with kids or maybe it doesn't. But it's interesting to think about the housing types we have chosen or were handed. Location and other factors certainly play a role.
What housing type have you lived in the most throughout your life? Let us know in the comment section below.
Cover photo by Michal GADEK on Unsplash
Do governments make good developers?
The Liberals just announced that, if elected, they will form a new entity called Building Canada Homes (BCH) which will, "get the federal government back in the business of building homes." Broadly speaking, this new entity is proposed to have three key functions: it will build affordable housing at scale (including on public land), it will help to "catalyze" the private sector, and it will provide financing to affordable housing developers. There's a lot that is interesting in the policy teaser, but let's focus on function number one today: Do governments make good developers?
The outlined intent is that BCH will "act as a developer to build affordable housing" and "partner with builders for the construction phase of projects." So it sounds like they will not be constructors. The language they use also suggests that BCH will be an acquirer of land. Sometimes it will develop on already-owned public land, but in other cases it will go out and buy new land, sometimes offering it back to the market via land leases.
Acquiring new land will be challenge number one. As we have talked about many times before on this blog, land should be the residual claimant in a development pro forma. Meaning the value of land depends on what you can build on it. So if BCH is looking to build affordable housing and the rest of the market is looking to build some higher-and-better use, it will be very difficult for them to complete in the market. This is the same reason why, historically speaking, the City of Toronto has struggled to acquire new parkland with the funds it collects from developers. It can't compete.
On the flip side, it's very possible that in a downmarket, like the one we're in right now, BCH might be the only real buyer of development land. Affordable housing requires subsidies and if the subsidies BCH has access to result in both feasible projects and higher residual land values, well then they'll be able to win sites. But it will depend on the market conditions at the time. It also raises an important question: What is the right level of subsidy for the affordable housing that BCH intends to develop itself?
The second challenge is going to be execution. Development is a risky endeavor, but most of the time the private sector accepts these risks because they believe they will be compensated accordingly. And once they have taken on these risks, they become highly motivated to deliver for their investors and partners. Will the federal government be equally motivated? Perhaps. There are, of course, lots of examples of public housing developers in other parts of the world. But is it the most effective way to deliver new affordable housing? An alternative approach would be motivating the private sector to participate.
Getting the federal government "back in the business of building homes" may sound promising, but there's reason to be skeptical. There will be lots of details to figure out if it's actually going to be efficient and effective.
Cover photo by Eduardo Alvarado on Unsplash
Season finale

Neat B and I were in Park City this past weekend for our last runs of the season. (Now it's time to pull out the impossibly tight spandex for road biking!) This is a trip we do often, but given the current geopolitical situation, we weren't exactly sure what to expect. But I will say that we were pleasantly surprised. When we picked up our rental car at SLC, the attendant, who was from Texas, immediately said that he was trying to figure out how to become the next Canadian province. He then proceeded to inquire about the quality of our brisket in a way that made it sound like a firm prerequisite. And virtually everyone we met on the mountain was extremely apologetic once they learned we were Canadians from Toronto. Frankly, they came across embarrassed, and they made it clear that they do not approve of what their government is doing right now. This made us happy to hear.
I still love you, Park City.
Cover photo by Alex Moliski on Unsplash
Some thoughts on work-life balance
Sahil Bloom tweeted this out a few days ago:

 8,424
8,424
And it really resonated with me. I'm sure it does with a lot of you as well. I'm guilty of feeling this guilt. Because by definition, if you have a strong desire to do or to achieve something, then you're going to want to spend a lot time working toward it. And any time not spent working toward it, can feel like an unnecessary slowdown or delay.
But it's easy to let time melt away when you're in this headspace and I'm trying to be better at not letting this happen. For one thing, there are diminishing returns to work. We all need free time and rest. It makes us better at everything else we do in life.
It's also really easy to fill our lives with unnecessary bullshit. The same thing happens in our homes when we're not paying attention: we end up collecting unnecessary stuff. So as Paul Graham argues in this 2016 essay called "Life Is Short", it's important to "relentlessly prune bullshit." Focus on the things that matter, and don't wait.
When you're ambitious, I think it's easy to become focused on the future. I've been told I do this too much. Achieving something usually requires hard work and determination, and that likely means it won't happen today; it'll happen at some point in the future. So it can be easy to discount the present. But nobody knows how much healthy future we all have.
These are all things that I'm trying to be better at and so I'm writing them down here as a reminder. How do you manage your work-life balance?
Cover photo by Christopher Gower on Unsplash
Sundance Film Festival is moving from Park City to Boulder

This past Thursday, the Sundance Institute announced that it will be moving the Sundance Film Festival from Park City to Boulder starting in 2027. This is sad. Sundance has been based in Park City since 1981 and it's the largest independent film festival in the US. Last year (2024), it is estimated that it created 1,730 jobs for residents, contributed $132 million in GDP to Utah, and produced about $13.8 million in state and local tax revenue.
Here's what Park City Mayor Nann Worel had to say following the announcement:
“For over 40 years Park City wasn’t just the host of the festival, we were its home. We helped shape the identity of Sundance with our unique energy, our colorful people, our undeniable spirit,” Worel said. “The world came here for film, yes, but they stayed for something more. They stayed for the feeling this town gave them. So, yes, I’m disappointed. Deeply. I know many of you are, too.”
“To our community: We are not defined by one event. Our creative spirit is deeper than any single festival. And while Sundance may be leaving, Park City isn’t going anywhere,” Worel said.
As I understand it, Utah offered to nearly double the amount of funding that they provide to the arts festival. But that clearly wasn't enough. There's also speculation that the festival left because it had overgrown Park City and/or because Colorado is viewed as being more liberal. There are people in Utah who do not approve of some of the content shown at said festival. I have no idea as to the actual reasons. But I do think it's a real loss for Utah.
Cover photo by Spencer Davis on Unsplash
New York's congestion pricing is doing what it's supposed to do
New York City was supposed to terminate its congestion pricing program last Friday because, well, Trump told them to. But they didn't do it and so harsh words were exchanged and then the deadline was extended for another 30 days. (This sounds oddly familiar.) Who knows what happens next month, but we are able to accurately quantify the benefits of nearly 3 months of congestion pricing.
Firstly, it's generating a lot of money. In the first two months of operation, congestion pricing has already brought in over $100 million in new revenue for the city. This is important because it's money that can be used for transit and other infrastructure improvements.
Equally important is the fact that this money was generated by creating measurable value for drivers. For all of the river crossings that lead into the CBD, average weekday travel times this past January are lower compared to January 2024. And in some cases, they're lower by a lot. The Holland Tunnel, for example, saw travel times drop by 48%.
Lastly, it's encouraging more people to take public transit. Here's a chart from Sam Deutsch over at Better Cities showing the increases in ridership since the program was implemented:
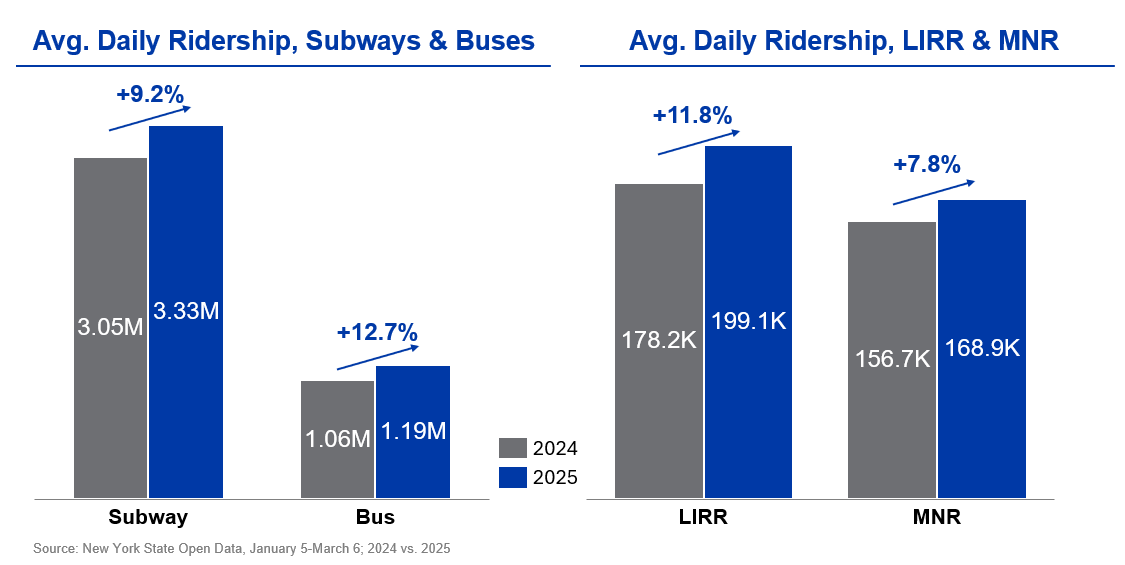
The MTA as a whole is now averaging about 448,000 more public transit riders per day. And to put this number into perspective, Sam reminds us that Washington DC has the second most-used public transit system in the US and that it sees an average of about 304,000 total riders per day (January 2024 figure). So in other words, New York's congestion pricing bump alone was nearly 1.5x DC's entire ridership base.
Some critics will argue that NYC's subway is dangerous and that this program unfairly pushes people toward it. But crime data suggests otherwise. New York's subway also saw over a billion rides in 2024! So I don't know how you argue that less people should be taking it. It's pretty clear that this is what moves the city. Imagine if the above went the opposite way and 448,000 more people started driving to work.
Some people may not like it, but the reality is that congestion pricing is doing exactly what it's intended to do: reduce traffic congestion, make money, and encourage more sustainable forms of urban mobility.
Cover photo by Wells Baum on Unsplash
Risky backyards
Among other things, insurance companies now use aerial photography, combined with AI, to better assess property-level risk. Here's an excerpt from Bloomberg Green:
“Weather and catastrophe losses are running ahead of the ability to manage them, and many insurers are having trouble sustaining their business because they’re not getting the right rates,” said Jay Guin, chief research officer of the extreme event solutions team at Verisk, a catastrophe modeling firm. “AI changes the equation.”
Zurich Insurance Group AG, one of the largest insurers in Europe, uses AI powered risk-modeling software to assess catastrophe risk and often tweaks it for its own purpose.
“If there’s fire hazard like vegetation, overhang or debris in your backyard that shouldn’t be there, we can tell you to lower the risk otherwise we may not be able to underwrite you,” said Ericson Chan, chief information and digital officer of the Swiss company.
What AI allows is a level of granularity that just wasn't possible when humans were the ones who had to do it. Insurers now talk about "continuous remote risk monitoring," meaning they can use AI-powered aerial imagery to constantly check on that risky debris in your backyard.
This feels like quite an improvement for the insurance industry. But when you more accurately price risk, I would imagine that it will lead to more insurers deciding to stay clear of certain risks and certain properties, as has already been the case in places like California.
Cover photo by Pim de Boer on Unsplash
Opendoor is back to positive gross margins
If you recall, the largest buyer of single-family houses in the US last year was Opendoor. This is according to SFR Analytics. Opendoor is a so-called iBuyer, meaning they provide cash offers to sellers, close quickly, and then turnaround and sell each home for — hopefully — a profit. They also collect commissions, and make money in other ways (such as through home loans).
This process seemed to be working reasonably well up until 2022, but then the market turned. They then quickly discovered that they couldn't sell their homes for a profit and so they ramped down acquisitions. Here's a chart from another post by SFR Analytics showing the fall off in purchase volume in the second half of 2022:

The worst performing market at this time was Phoenix, which apparently accounted for around 50% of the company's losses. In some cases, their gross margins were -$60,000 per property. But once they recalibrated their models (I'm just assuming this is what they did), they were able to regain positive unit economics. Here's Phoenix starting from their January 2023 cohort:

Opendoor has not done well as a public company. But it is the biggest buyer of single-family houses and it seems to be back to positive gross margins. Maybe that's something.
Charts from SFR Analytics; cover photo by Chris Tingom on Unsplash
Paris votes to pedestrianize an additional 500 streets
This past Sunday, Paris voted in favor of greening and pedestrianizing an additional 500 streets in the capital (5-8 per neighborhood). This will add to the 300 or so streets that have already received this treatment since Mayor Hidalgo started her second term in 2020. And as a result of this expansion, it is estimated that about 10,000 on-street parking spaces will be removed, which represents about 10% of the city's total inventory.
Exciting. But who voted for this? Of the Parisians who voted, 66% voted in favor of the initiative. And it carried in 14 of 17 arrondissements (with the 1st, 2nd, 3rd, and 4th counted as one). But similar to prior referendums, voter turnout was extremely low: only 4.06% of eligible voters showed up (approximately 56,500 people). And this is after the voting age was lowered to 16 years old for the first time.
For context, when Paris voted on whether electric scooters should be banned, 7.46% of voters showed up. So while low, this situation is not entirely unique. Though it does, once again, raise the question of whether the outcome of this referendum truly reflects public opinion. My outsider view is that it probably does. Because I take the apathy to mean some level of support, or at the very least, an absence of strong aversion.
Think, for example, about who shows up at community meetings for new development projects. The vast majority of people in attendance have concerns they would like to air. It's very rare for someone to show up and say, "I didn't have much going on tonight so I decided to come by and see everyone. I have no real concerns. Project looks cool. Carry on as you were."
If you agree with this logic, well then it suggests that many/most Parisians do generally support more pedestrianized streets, even if it means the removal of parking. That's an accomplishment in my books.
Cover photo by Maximilian Bungart on Unsplash